Energy
How Oil is Formed
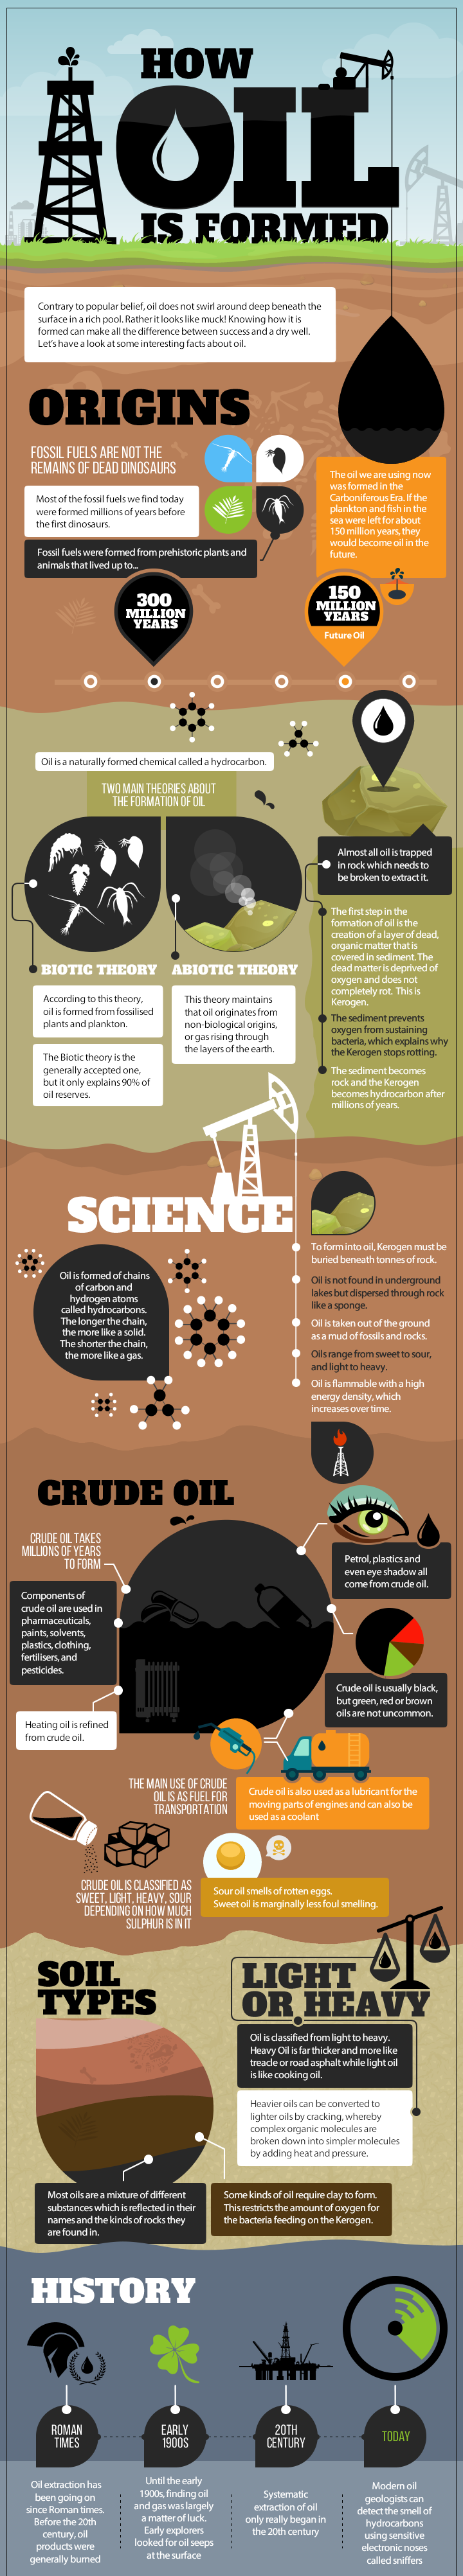
Does the oil we use today originate from the remains of dead dinosaurs?
No, but the actual answer is just as interesting.
The generally accepted theory is that today’s oil reserves come from organic materials that existed millions of years before dinosaurs roamed the earth. About 300 million years ago, these dead organic materials such as zooplankton and algae built up on the bottom of lakes and oceans in conditions where they couldn’t decompose. The organic matter then changed into kerogen, which eventually turned into oil through heat and pressure.
Today’s infographic further details how oil is formed, while also covering some of oil’s uses and history. It also mentions an alternate theory on how oil is formed, which we dive into deeper below.
Courtesy of Jones Oil
How Oil is Formed – An Alternate Theory?
While the aforementioned theory on fossilized organic material is thought to explain the vast majority of Earth’s oil reserves, there is actually another theory on how oil is formed that has been around for over a century. If it were ever proved to be true, it would be a game-changer for how we think about the world and natural resources.
The theory of abiotic oil postulates that some oil on Earth originated from non-organic materials. In other words, it is made somehow by natural forces deep in the planet, or it was deposited on in the crust by meteorites. To be fair, it is true that hydrocarbons have been proven to exist in outer space, where there are no organic materials. It was also shown in 2009 that ethane and heavier hydrocarbons can be synthesized under the pressure-temperature conditions of the upper mantle.
The trouble with the theory? So far, abiotic oil has not been proven to exist on Earth in any economic quantities. Oil exploration geologists have also not been able to make any discoveries using abiotic theories, and many abiotic claims have been debunked as pseudoscience.
For now, this theory seems like a long shot, but it’s still interesting to think about.


Who’s Building the Most Solar Energy?
This was originally posted on our Voronoi app. Download the app for free on iOS or Android and discover incredible data-driven charts from a variety of trusted sources.
In 2023, solar energy accounted for three-quarters of renewable capacity additions worldwide. Most of this growth occurred in Asia, the EU, and the U.S., continuing a trend observed over the past decade.
In this graphic, we illustrate the rise in installed solar photovoltaic (PV) capacity in China, the EU, and the U.S. between 2010 and 2022, measured in gigawatts (GW). Bruegel compiled the data..
Chinese Dominance
As of 2022, China’s total installed capacity stands at 393 GW, nearly double that of the EU’s 205 GW and surpassing the USA’s total of 113 GW by more than threefold in absolute terms.
| Installed solar capacity (GW) | China | EU27 | U.S. |
|---|---|---|---|
| 2022 | 393.0 | 205.5 | 113.0 |
| 2021 | 307.0 | 162.7 | 95.4 |
| 2020 | 254.0 | 136.9 | 76.4 |
| 2019 | 205.0 | 120.1 | 61.6 |
| 2018 | 175.3 | 104.0 | 52.0 |
| 2017 | 130.8 | 96.2 | 43.8 |
| 2016 | 77.8 | 91.5 | 35.4 |
| 2015 | 43.6 | 87.7 | 24.2 |
| 2014 | 28.4 | 83.6 | 18.1 |
| 2013 | 17.8 | 79.7 | 13.3 |
| 2012 | 6.7 | 71.1 | 8.6 |
| 2011 | 3.1 | 53.3 | 5.6 |
| 2010 | 1.0 | 30.6 | 3.4 |
Since 2017, China has shown a compound annual growth rate (CAGR) of approximately 25% in installed PV capacity, while the USA has seen a CAGR of 21%, and the EU of 16%.
Additionally, China dominates the production of solar power components, currently controlling around 80% of the world’s solar panel supply chain.
In 2022, China’s solar industry employed 2.76 million individuals, with manufacturing roles representing approximately 1.8 million and the remaining 918,000 jobs in construction, installation, and operations and maintenance.
The EU industry employed 648,000 individuals, while the U.S. reached 264,000 jobs.
According to the IEA, China accounts for almost 60% of new renewable capacity expected to become operational globally by 2028.
Despite the phasing out of national subsidies in 2020 and 2021, deployment of solar PV in China is accelerating. The country is expected to reach its national 2030 target for wind and solar PV installations in 2024, six years ahead of schedule.

-

 Markets6 days ago
The Most Valuable Companies in Major EU Economies
-

 Wealth2 weeks ago
Charted: Which City Has the Most Billionaires in 2024?
-

 Technology2 weeks ago
All of the Grants Given by the U.S. CHIPS Act
-

 Green2 weeks ago
The Carbon Footprint of Major Travel Methods
-

 United States1 week ago
Visualizing the Most Common Pets in the U.S.
-

 Culture1 week ago
The World’s Top Media Franchises by All-Time Revenue
-

 voronoi1 week ago
Best Visualizations of April on the Voronoi App
-

 Wealth1 week ago
Charted: Which Country Has the Most Billionaires in 2024?